摘要:这是一篇比较东亚全球城市网络连通性的实证论文。2018年,本文作者收集了全球化先进生产性服务业企业在城市存在的信息,其出发点是,定义世界城市网络为“互锁网络”,其中先进生产者服务在城市网络形成发挥关键作用。这些信息被转化为数据,以708(城市)×175(企业)矩阵的方式,评估各城市为企业提供企业服务的“服务价值”。之后,这些数据被用作互锁网络模型的输入,以衡量城市的连通性及其主要地理方位。我们还将互连性的衡量标准与2000年的标准进行比较,制定了变化的衡量标准。我们对东亚主要全球城市的结果进行比较和解释,为研究者在研究中国城市在全球化中的地位转变提供参考背景。
关键词:网络互联;东亚;全球城市;世界城市网络
作者简介:Peter J. Taylor, Emeritus Professor of Human Geography at Northumbria University in Newcastle upon Tyne, and Emeritus Professor of Geography at Loughborough University, Fellow of the British Academy.Ben Derudder, Professor of Human Geography in the Department of Geography at Ghent University.
1. Introduction
There is currently a considerable literature on the role of cities as key nodes in an increasingly globalized economy. One expression of this can be found in recent large edited volumes: Scott, Brenner and Keil, Taylor et al., Derudder et al., Keil and Ren, and Hoyler and Harrison muster over 500 papers between them but still represent only the tip of this particular iceberg. Within this literature, the research in the context of the Globalization and World Cities Research Network (GaWC) has pioneered a relational approach to understanding cities in globalization as a “world city network” (WCN). In developing a theoretically grounded measurement of WCN formation, GaWC has drawn explicitly upon Sassen’s seminal writings on a select number of cities functioning as the primary production site and market for financial, professional and creative services for corporate business. In her initial argument, Sassen identified Tokyo as one of her three “global cities” alongside NY and London. However, in the last three decades there have naturally been momentous urban-economic developments across East Asia, and in this paper we draw upon our measurement of WCN formation to compare how major cities in this world-region are faring in contemporary globalization.
Sassen’s core argument still stands: major firms across the world have become increasingly dependent on producer services, such as financial services, accountancy, advertising, law, and management consultancy which offer customized knowledge, expertise and skills to their corporate clients. In this process, many of these service firms have become transnational enterprises in their own right as they have expanded into a growing global market to both service their existing customers and acquire new clients, Harrington and Daniels. Global cities have a particular component in their economic base that gives them a specific role in the current phase of the world economy: they are the business service centres that have a key enabling role in economic globalization. Our approach, developed as part of the Globalization and World cities (GaWC) research network, is based upon Sassen’s thesis. However, we depart from her approach in identifying more than just the key global city in each of the major globalization arenas in the servicing of global capital: New York for Northern America, London for Europe, Tokyo for East Asia. In this we follow Manuel Castells’s Manuel argument for a network society that encompasses a “global network” of cities that cannot be reduced to the urban cores at the very top of the hierarchy. This opens the scope for detailed analysis of a very large number of cities in a single framework, but here we take a middle ground by focusing on the five East Asian cities ranked in the top 10 of most connected cities in the world city network in 2018: Beijing, Shanghai, Hong Kong, Singapore, and Tokyo.
The initial application of the GaWC model was the measurement and subsequent empirical analysis of the WCN in the year 2000. In practice, the analyses were based on information on the locational strategies of 100 leading business service firms in 315 cities worldwide. Since then, new and slightly revamped data collection exercises have been carried out, leading to an update of the initial findings and argument. Importantly, this encompasses both new data analysis strategies and using these to answer different types of research questions. For example, we developed a methodology that allows singling out which advanced producer services firms have the most strategic networks, which in turn allow identifying the most strategic global cities. More recently, we developed a conceptual and an empirical extension of world city network research to describe the major globalization phases that have been shaping the 21st century: we reiterate the narrative of the extensive, intensive and the unfolding Chinese globalization phases as reflected in world city network formation.
In this paper, however, we go “back to basics” and use 2018 data to provide a detailed overview of the position of the five East Asian cities ranked in the top 10 of the most connected cities in the world city network in 2018. Although GaWC is arguably above all known for its connectivity ranking of cities, world city network analysis allows us to tell much more than this one popularised result. This is exactly what we do in this paper, the remainder of which is organized in four main sections. First, we position our research in the context of other, similar research efforts. Second, we summarize the basic parameters of the interlocking network model. Third, we present results and interpretations for Asia’s major global cities. Fourth and finally, we conclude with a conceptual discussion of the important ways that our modelling and results might begin to be theoretically integrated into wider related literature featuring relational urban research.
2. Position within the global cities literature
The WCN approach invoked in this paper is only one of a range of different empirical approaches trying to measure the global prominence of cities. Indeed, there has been a recent surge in quantitative research on city networks, and the interlocking network model (INM) is therefore but one of the analytical possibilities around. In general, two types of “solutions” for specifying city networks at the global scale have been devised in the literature: direct and indirect measures of inter-city connections, respectively.
Precise measurement solutions have been found in two different sets of data. First, and most directly, there is ancillary information on the provision and execution of movements between cities, both material and virtual, by companies providing transport and communication services. Second, there is information on corporate command structures, specifically headquarter-subsidiary relations indicating flows of directive between cities. Both solutions constitute key infrastructures that have enabled global inter-city connections to develop, and there is therefore a clear-cut rationale for the often-refined analysis of these infrastructures to map how cities are connected to globalisation.
Indirect measures are based upon a modelling of inter-city connections. The results are not actual inter-city flows, but potential flows based on assumptions regarding interaction patterns within multi-locational organisations. The INM is essentially such a model, with the basic assumptions being that (1) a shared presence of an organisation in any pair of cities opens up the potential for inter-city interaction, with (2) the level of potential interaction depends on the importance, size, and operational capabilities associated with the organisation’s presence in those cities. The INM produces measures of “network connectivity” of cities by drawing on established thinking in social network analysis for a different city network application and research on what are commonly called bipartite network projections. It is useful to point out that the INM is but one of many possible bipartite network projections advanced in the social network analysis literature. The INM was initially chosen because of the relative simplicity of its basic assumptions, but over the years it has been modified and extended. Neal and Hennemann and Derudder, for example, have specified alternative bipartite network projections, discussing under which circumstances and assumptions these alternatives would represent improvements over the base model.
Cross-cutting these developments have been the use of other agents than producer services firms. In addition to non-governmental organizations, maritime services firms, media firms, and energy firms, recently we have also seen a rising focus on culture. Diéz-Pisonero et al., for example, highlight the convergence between economic and cultural spheres in global cities, known as the “cognitive-cultural economy,” and use this to develop an index of cultural world cities.
These advances have creatively extended the boundaries of empirical global cities research. In this context, it is perhaps better to speak of INM-inspired research than of INM research per se. While we acknowledge and welcome these extensions. In this paper we stick to the most basic version of this model. In the subsequent sub-sections, we summarize the model and data gathering invoked in this paper; readers are referred to Taylor & Derudder for a more encompassing discussion of the methods and data, as well as the model’s limitations and extensions.
3. Data and Methodology
3.1 Data collection
Our approach to look into the world city network draws on data on the office networks of advanced producer services (APS) firms across global cities. The elemental measure of this location matrix is called a service value vij, which standardizes information on the importance of the presence of APS firm j in city i. These observations can be arrayed as a service value matrix V across firms and cities. Data collection entails assigning service values to a large number of firms and cities.
The gist of this data collection exercise is explained in detail in Taylor and Derudder, and will be summarized here for the latest 2018 data gathering to make this paper-self-standing. Our selection of APS firms is built on rankings of leading firms in five producer services sectors: seventy-five financial services firms, twenty-five management consultancy firms, twenty-five advertising firms, twenty-five law firms, and twenty-five accountancy firms. Informationon the location strategies of these 175 firms was gathered between July 2018 and September 2018. Firms were selected based on sectorial rankings for 2017, which seemed to be based upon 2016 data. For each sector, the top-ranked firms were chosen. Cities were selected based on a number of overlapping criteria, including size (population), political status (capital cities), presence of (regional) headquarter functions in APS firms, and previous research. Our overall approach here has gone to be as inclusive as possible, ensuring that there were no potential omissions as we recorded information. This resulted in the selection of 707 cities.
A putative “global presence” — no matter how uneven it is in practice — has become an integral part of leading firms’ public marketing and recruitment policies. Hence among APS firms, locational strategy is perforce quite transparent. Corporate websites of these firms therefore customarily showcase the geographical range of the services on offer. Advantage is given to this geographical transparency for information gathering. For each of the 175 firms, two types of information have been collected. First, information about the size of a firm’s presence in each of the 707 cities is obtained, ranging from the number of offices the firm has in a city for accountancy/financial services firms to the areas of expertise for law firms. Second, extra-locational functions of (an) office(s) (e.g. headquarter functions) in a city are recorded. The end result is that for each of the 175 firms, information is available to create standardized service values vij in each of the 707 cities. This standardization involved assigning values ranging from 0 to 5 as following. The city housing is a firm’s headquarters was scored 5. A city with no office of that firm was scored 0. An “ordinary” or “typical” office of the firm resulted in a city scoring 2. To something missing (e.g. no partners in a law office), the score reduced to 1. Particularly larger offices were scored 3 and those with important extra-territorial functions scored 4. The end result was a 707 x 175 matrix V where vij ranges from 0 to 5.
3.2 The interlocking network model
The INM produces network measures based on a projection of V, so that APS offices are treated as commercial assets of a city that are important because of the practices employed by the professionals distributed in the organization’s networks and the flows of information, knowledge, instruction, ideas, innovations, personnel, etc. through their offices as per Allen’s observations. The numerical specification of the INM is based on the specification of city-dyad connectivity CDCa-b, j between cities a and b for APS firm j :
![]()
The value of CDCa-b, j is not actual measure of inter-city connectivity, but a guesstimate of the potential level of connectivity based on the assumption that (1) a shared presence of an APS firm in a pair of cities opens up the potential for inter-city interaction (electronic messages, telephone conferences, face-to-face meeting through business travel), while (2) the level of potential interaction depends on the importance, size, and operational capabilities associated with the APS firm’s presence in those cities.
Aggregating these firm-level city-dyad connectivities CDCa-b, j produces overall levels of city-dyad connectivities CDCa-b between pairs of cities :

And finally, aggregating a city’s city-dyad connectivities CDCa-b across all other cities produces a city’s global network connectivity GNCa :

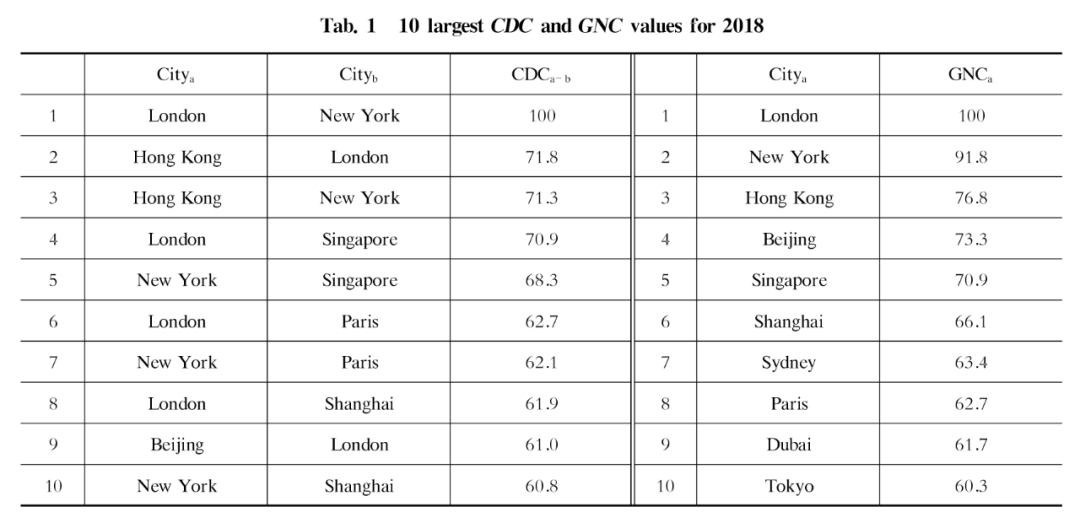
To make both CDCa-b and GNCa independent of the number of firms j and the number of cities b in the data, these measures are commonly reported as a percentage of the most connected city-dyad (New York-London) and the city (London), respectively. To get a feel for the basic contours of this approach, Table 1 list the ten most connected city-dyads and the ten most connected cities for 2018. The London-New York dyad clearly stands out, and the importance of both cities is reinforced by the observation that the ten most important connection feature one of both cities. The first city-dyad not involving either New York or London is Singapore-Hong Kong, ranked 19th.
Importantly, the specification in equations (1) and (2) also allows the revealing of various geographical and functional patterns within overall connectivity: two cities with a similar level of GNC may in fact be connected to very different sets of cities as gauged by their distribution of CDC. To tease out these geographical and functional patterns, rather than aggregating all connection as per equation (3), we can produce different aggregation. Here we will focus on three specific components of cities’ connectivities, i.e. the relative
importance of their connections with New York and London; the relative importance of their connections with the 10 most connected cities; and the relative importance of their connections with other cities in the same world-region (in this case East Asia). Results of these measures are to be interpreted as follows: a positive value implies that a city has stronger connections with the particular subset of cities than expected; a negative value implies that a city has weaker connections with the particular subset of cities than expected; and, the larger the value, the stronger this overall tendency. Note that this is a relative measure that is therefore in principle independent from a city’s GNC.
Our final measure is a measure of change: to assess cities’ changing connectivities as per equation (3). We can compare the 2018 values with those of 2000. Having discrete snapshots of the world city network allows analysing the trajectories of individual cities. The measure of change we report upon is a relative measure of change: it is best interpreted as a z-score: for example, cities with an absolute value of ≥ 2 have witnessed exceptional connectivity change in 2000—2018, while cities with a value close to 0 have seen a connectivity change in line with the change in the distribution at large.
4. Results
Five analyses comparing Asian global cities are reported. The first two focus on global network connectivities, the latter three on specific connectivities within the world city network.
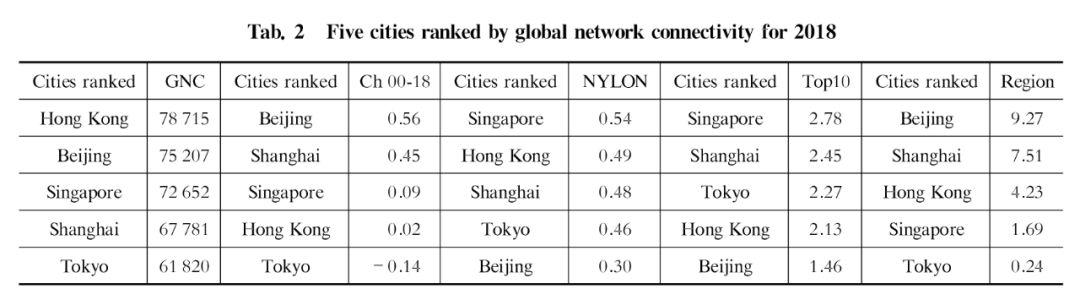
The decline of Tokyo is demonstrated in Table 2 with the relative change in connectivity since 2000. In 2000 Japan was the leading Asian economy and Tokyo banks were leading players across the network. However subsequently Japan’s economic stagnation is reflected in Tokyo’s reduced role in the world city network. Hong Kong’s role as gatekeeper has remained the same over this period and its connectivity has changed little. Singapore has fared better as it has developed beyond its early gateway function. Nevertheless, the massive change has been the very large increases for Shanghai and Beijing as part of China’s rise as a major economic power in the global economy.
Table 2 singles out connection to specific sections of the world city network. This enables us to begin to understand the diverse ways that the five cities are integrated into the world city network. By far the two most connected cities in the world city network are London and New York (NYLON) and the key comparison in Table 2 shows the degree that Asian global cities are linked to just these two cities. Singapore is the most connected in this analysis, confirming its transcending the city’s original gatekeeper role. Hong Kong, Shanghai and Tokyo are very close on this measure, reflecting the latter’s early prominence with New York and London that Sassen described. Nonetheless, the most interesting feature of this ranking is Beijing’s at the bottom; a very different level of NYLON connectivity from the other four cities. This suggests it has a unique distinctive role in the world city network.
This latter finding is confirmed when the other leading cities (those ranked in the top ten for connection) are added to the analysis in the second ranked comparisons in Table 2. Beijing is again adrift at the bottom of the table; the city is relatively less well connected to other global cities such as Paris. Singapore remains the most connected to leading cities but the other three cities are shuffled around. Hong Kong with its broader network beyond NYLON is now second bottom allowing Shanghai and Tokyo to move up. Shanghai’s relatively high connection suggests that it is taking up the slack from Beijing to become China’s core city for inter-city connections to other leading cities across the world.
In the final comparison the five cities are ranked in terms of their connection to all other East Asian cities in the data. The differences in this analysis are very stark. Shanghai and, especially, Beijing is very strongly connected to these cities reflecting their importance within China whence a large number of East Asian cities are from. As a gateway city Hong Kong also is under a high level of connectivity compared to Singapore, again suggesting the latter’s gateway regional function to be rather less important. Tokyo is totally unlike on this measure where Chinese cities dominate.
These analyses provide a glimpse of how the methods employed allow detailed assessment of cities in terms of how they are integrated into the world city network and therefore their exact roles in making and maintaining the network. For instance there is a strong hint of the findings presented here that the integration of Beijing and Shanghai into the world city network indicates a degree of complementarity, linking to cities outside China in different ways.
Conclusions
This paper provides researchers with a backcloth for reference when studying the shifting position of East Asian cities in globalization. We emphasize that our approach represents but one specific vantage point in the quantitative analysis of cities in globalization. Other analytical frameworks exist in the literature, and these may or may not generate different results. Nonetheless, we believe that our approach is relevant: 1) conceptually, because the leading services firms we focus on are the key agents in the city network formation process; and 2) methodologically, because consistency in our approach allows for coherently assessing change in a city’s overall “importance.”
Examining the connectivity change between 2000 and 2018 reveals that above all Shanghai and Beijing have reported major connectivity gains among East Asian cities. Although an earlier, parallel analysis of changes of Chinese cities has shown that this shift is complex and variegated, it is noteworthy that with the exception of the SARs (Hong Kong/Macau) and cities in Taiwan (Taipei/Kaohsiung) all Chinese cities record connectivity gains. Second, this wholesale rise in connectivity is nonetheless geographically uneven, with above all Beijing and Shanghai standing out in terms of global connectivity. The “Going Global Strategy” not only promoted the economic influence of China in the world, but also boosted Shanghai and Beijing, alongside other major East Asian cities, to articulate into the WCN. In recent years, the general “Going Global Strategy” has been embodied into more specific and ambitious grand plans such as the Belt and Road Initiative (BRI) supported by the newly founded Asian Infrastructure Investment Bank. This blueprint is aiming to leverage rising China’s capabilities with respect to capital, logistics, and personnel into connecting a more integrated and innovative network for multilateral economic governance across the Eurasian and African continents. Unlike the counter current tendency on globalization within some economic bodies after the global economic crisis, this outgoing strategy of China will indeed open up more opportunities for Chinese enterprises seeking to go global. Consequently, other Chinese cities along the BRI will have more possibilities to gain connectivity in the WCN, not only some of the more connected cities like Shanghai and Beijing, but also the less connected cities that are addressed as strategic points in the plan, such as Xi’an and Urumqi. Paralleled with these plans, other newly framed domestic nationwide spatial and economic rebalancing strategies, such as “the Yangtze River EconomicZone,”“Beijing-Tianjin-Hebei Synergy Development Plan” and “Yangtze River Delta Urban Agglomeration Development Plan” etc., will also boost more cities to articulate into the global network and seek for the advantageous positions in the world in general and East Asia and China in particular.